Statistical framework of the ARTFISH methodology
Source:vignettes/04_artfish-methodology.Rmd
04_artfish-methodology.Rmd1. Introduction
This vignette presents the statistical and conceptual framework that
underpins the ARTFISH methodology implemented in the
artfishr package.
The aim of the ARTFISH methodology is to produce country-level estimates of catch and fishing effort. It is a sample-based approach relying on stratified random sampling.
ARTFISH stands for Approaches, Rules and Techniques for Fisheries Statistical Monitoring. It was developed as a standardized methodology adaptable to most fisheries in developing countries. Its design was driven by the need to provide users with robust, user-friendly, and reliable approaches while supporting the implementation of cost-effective fishery statistical systems with minimal external assistance.
The methodology was developed and described by Constantine Stamatopoulos (Stamatopoulos, 2002) and is currently promoted by the Food and Agriculture Organization of the United Nations (FAO).
2. ARTFISH methodology
2.1 Presentation of the generic formula
ARTFISH is based on the concept of catch per unit effort (CPUE), using the following relationships:
Where:
-
Catch refers to the total catch (all species
combined) and is usually estimated within a defined context:
- a geographical area (stratum),
- a reference period (e.g. one calendar month),
- a specific fishing unit.
- CPUE (estimated from the sample) is the average catch per unit of effort. It represents the average quantity of fish (all species combined) caught per unit of effort within the same estimation context.
- Effort (estimated from the sample) is expressed as the total number of boat-days within the same estimation context.
CPUE and effort are estimated from sample data. The data sources may vary depending on the information available in each country and the survey design implemented.
Figure 1 illustrates the estimation process when sampling is performed in both time and space, that is, when only a subset of sampling days and landing sites is surveyed.
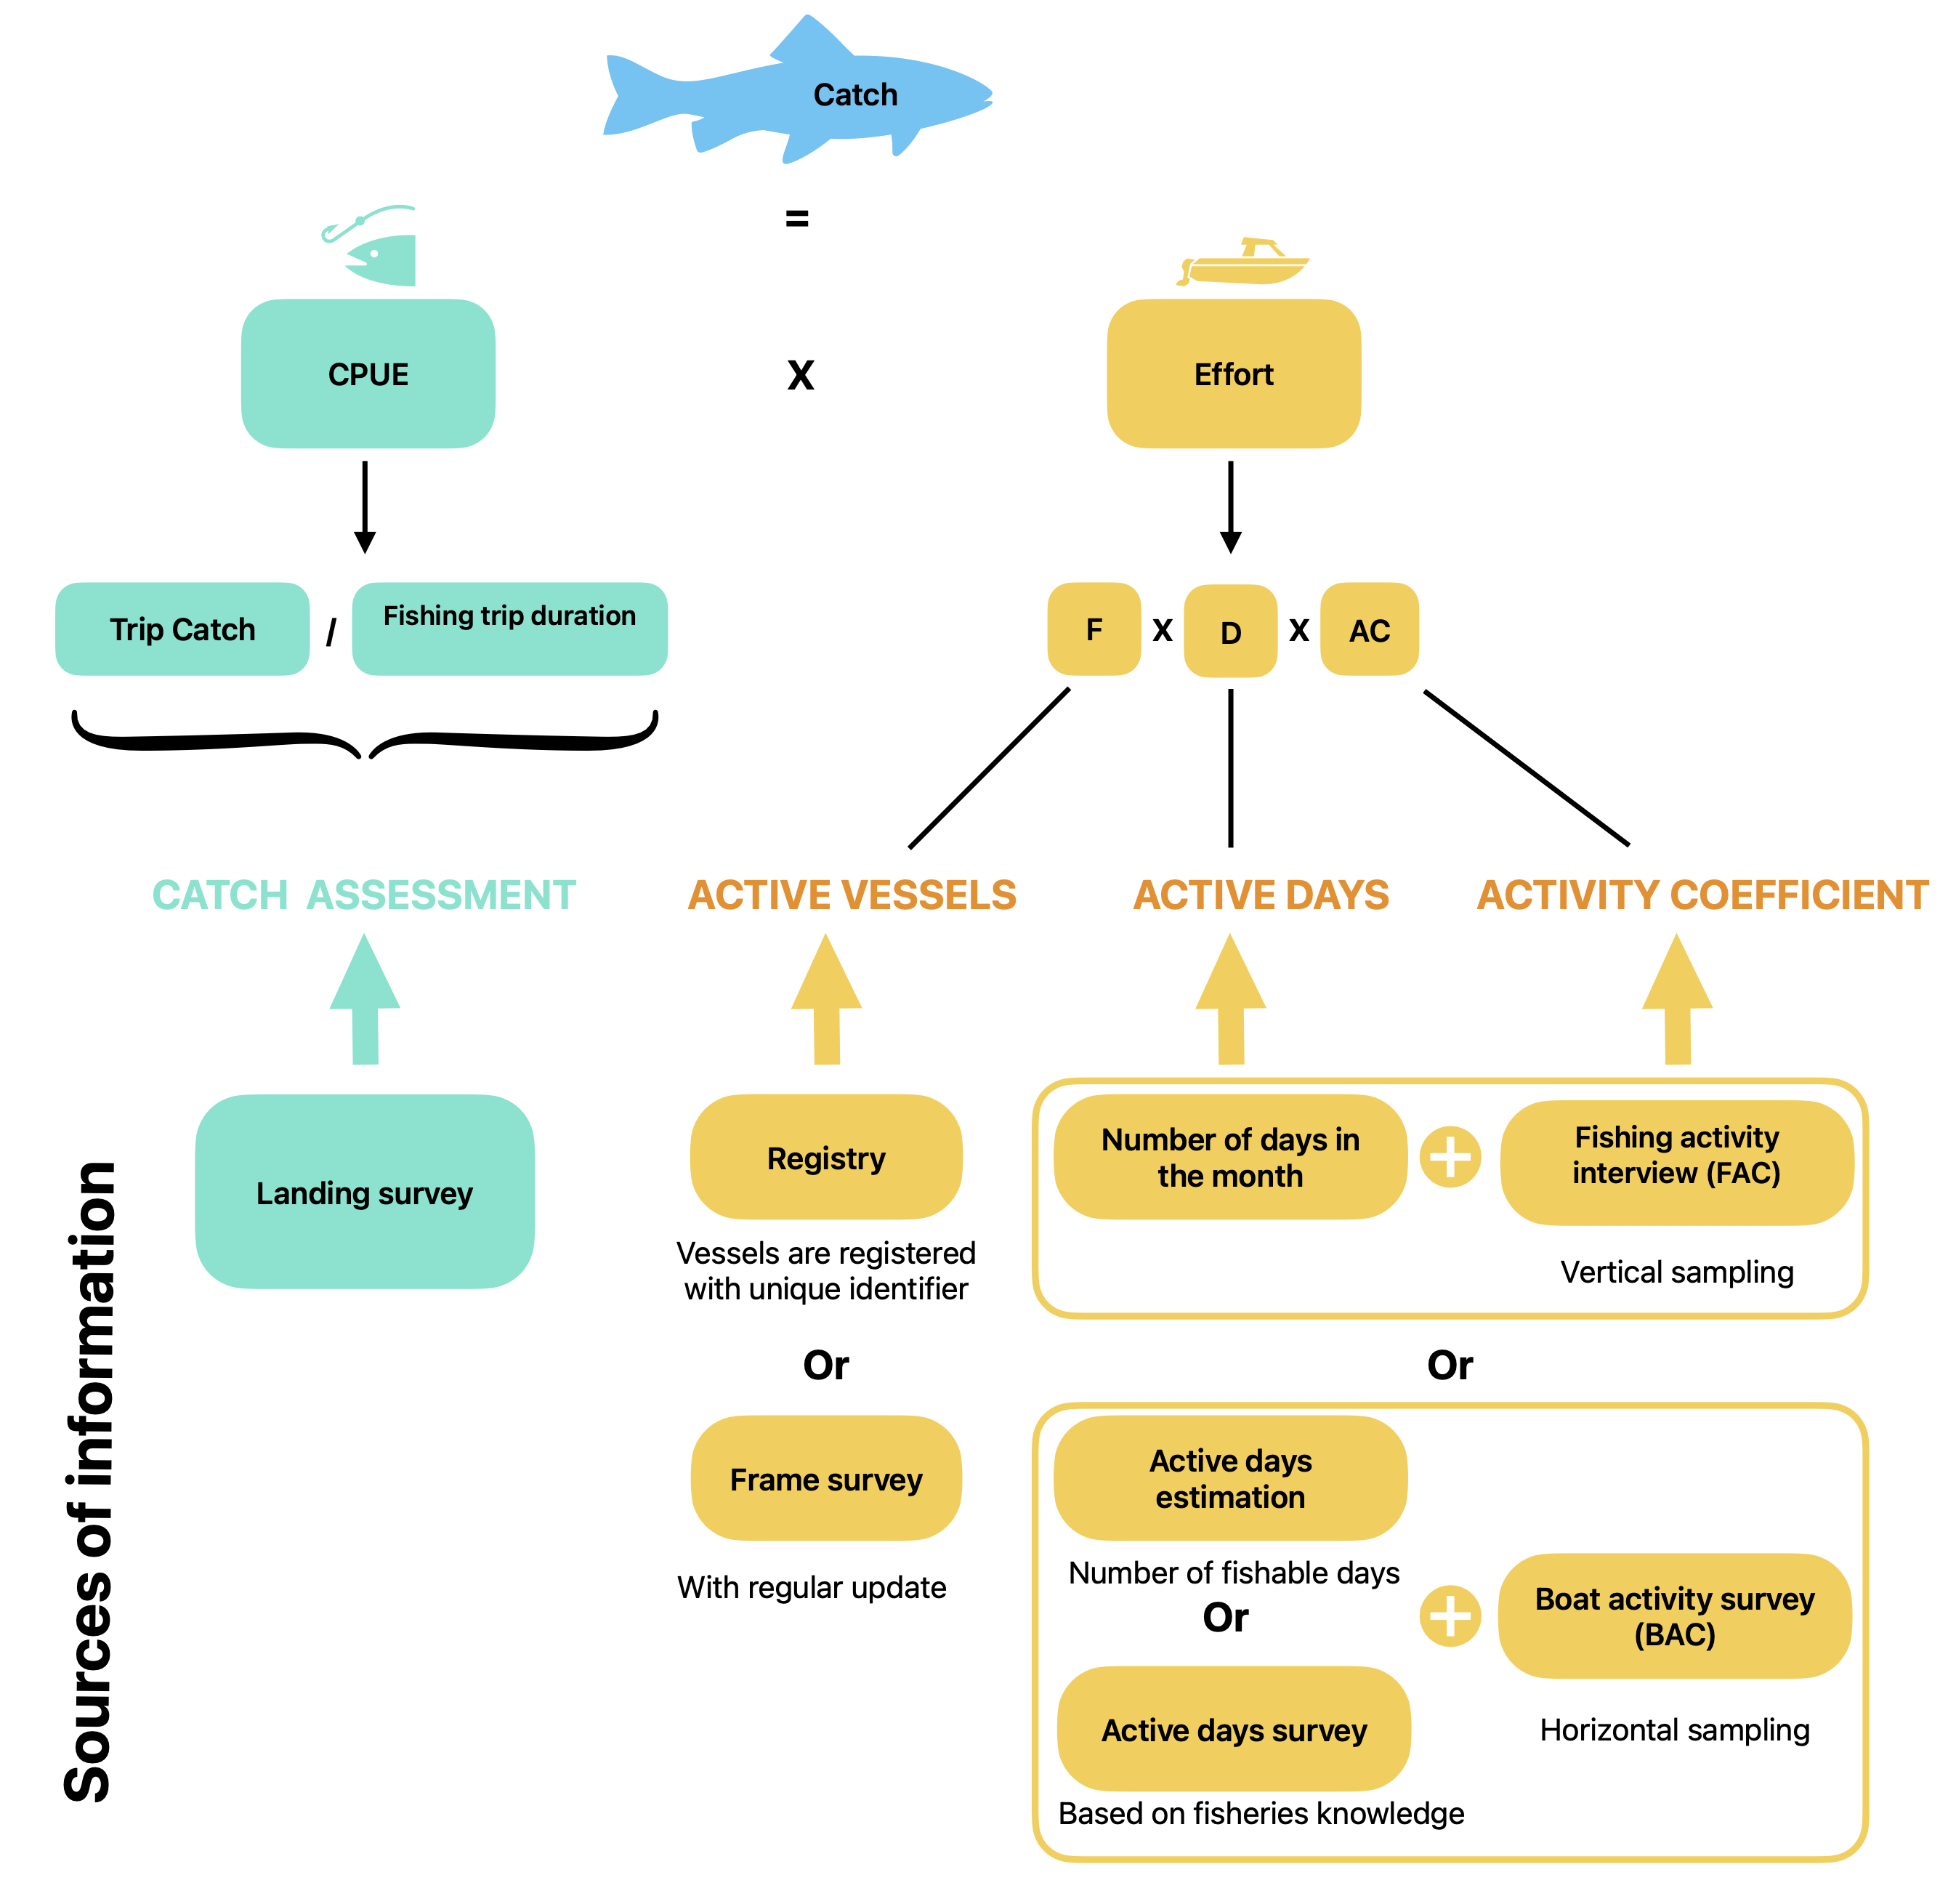 Figure 1. ARTFISH conceptual framework.
2.2 Stratification
As in most statistical methods, ARTFISH estimates are first computed for each stratum before being aggregated to produce estimates at higher levels (e.g. total national catch).
The first level of stratification generally corresponds to the reference period. In ARTFISH, data collection is usually organised on a monthly basis. However, fishing seasons may be more appropriate than calendar months in some contexts. The selected reference period therefore defines the first level of stratification.
Additional levels of stratification can be defined when required:
- Major strata, usually based on administrative, geographical, or temporal criteria.
- Minor strata, corresponding to subdivisions of a major stratum.
- Fishing units, representing the lowest level of stratification. Fishing units are defined to describe the structure of the fisheries sector within the country.
Major and minor strata are optional and should only be defined when justified by the local context or logistical constraints.
Important
Population parameters are always estimated at the lowest level of stratification. Estimates at higher levels are obtained by aggregating the corresponding lower-level estimates.
The sample size for each stratum can be determined using preliminary data. When no prior information is available, the following sampling effort is recommended:
- 8 to 12 sampling days per month;
- at least 30 landing surveys;
- at least 70 effort surveys.
3. CPUE
CPUE is calculated from data collected during the landing survey and is expressed as the weight of catch (kg or lbs) per day.
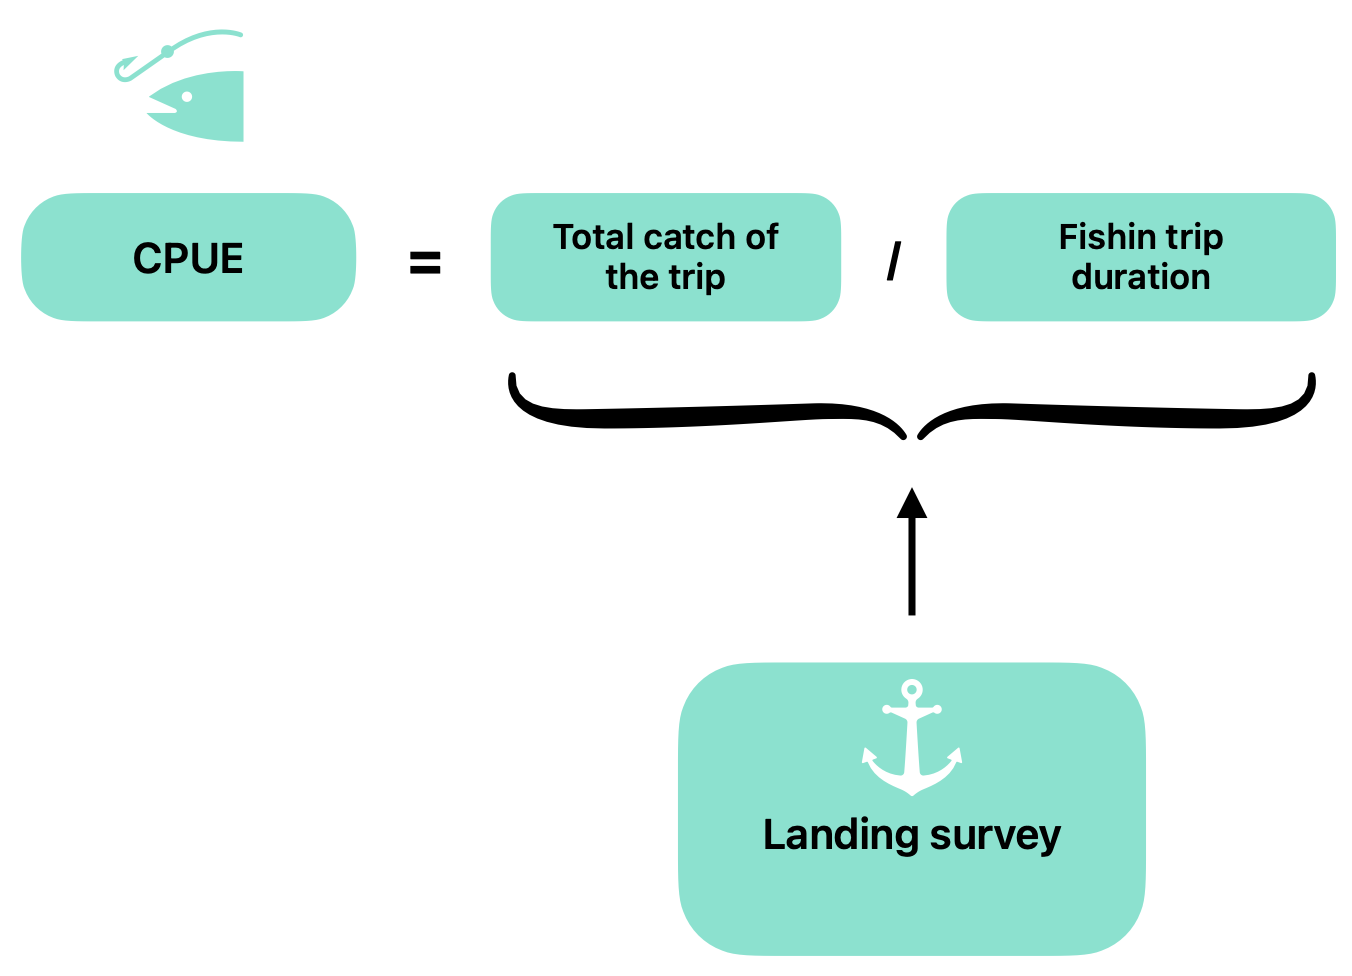 Figure 2. CPUE estimation principle.
To estimate CPUE, the following variables must be collected:
- the fishing unit (as defined in the sampling plan);
- the total catch weight (all species combined, and detailed by species for estimation per species);
- the fishing trip duration (i.e. time spent fishing).
CPUE is calculated for each stratum (defined by the combination of a reference period, major and/or minor strata, and fishing unit) using the following formula:
Where:
- is the total catch of the -th sampled fishing trip.
- is the fishing effort associated with the -th sampled fishing trip.
- is the number of fishing trips sampled within the estimation context.
In ARTFISH, the unit of effort is expressed in days, corresponding to the fishing trip duration (or time spent fishing, depending on the level of detail collected). Consequently, the CPUE formula used in ARTFISH becomes:
Table 1. Example of landing survey records used for CPUE calculation.
| Fishing trip ID | Catch | Catch unit | Effort | Effort unit |
|---|---|---|---|---|
| Fishing trip 1 | 165 | kg | 2 | day |
| Fishing trip 2 | 0 | kg | 1 | day |
| Fishing trip 3 | 90 | kg | 1 | day |
The CPUE is therefore calculated as:
Warning
Fishing trips with zero catch must be recorded and included in the calculation.
In this example, excluding fishing trips with zero catch would result in:
As a consequence, the overall catch would be overestimated.
4. Effort
4.1 Presentation
When sampling is performed in both time and space, the estimation of fishing effort requires three components.
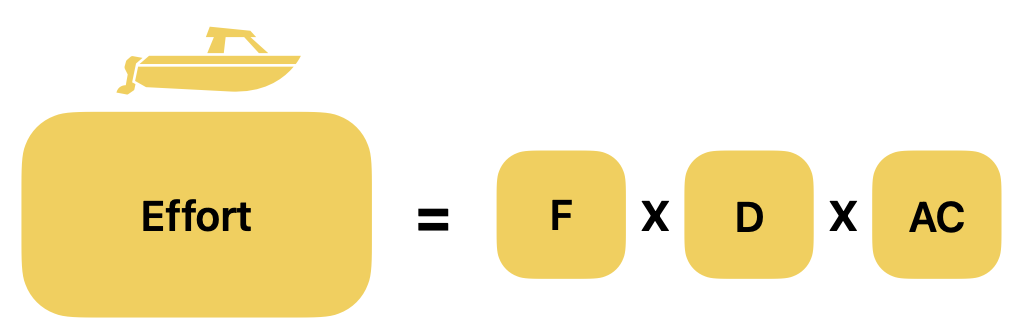
Figure 3. Effort estimation principle.
Where:
- is the raising factor expressing the total number of days with fishing activity during the reference period. It is estimated from an active days survey.
- is the raising factor expressing the total number of fishing units potentially operating across all fishing sites within the stratum. It is estimated from a frame survey or a vessel registry.
- is the activity coefficient. Fishing unit activity can be estimated either through the boat activity coefficient (), using vertical sampling (boat counts), or through the fishing activity coefficient (), using horizontal sampling (fisher interviews).
The total fishing effort is therefore estimated as:
or
Both and express the probability that a fishing unit (boat) is active on any given day during the reference period. is estimated from a boat activity survey, whereas is estimated from fisher interviews.
4.2 Number of active vessels: Estimation of the raising factor expressing the total number of active fishing units ()
The raising factor represents the number of boats that are active within the fishing fleet and are therefore potentially capable of fishing during the sampling period.
Depending on how the fleet is managed, can be estimated from:
- a frame survey, when boats are not registered;
- a vessel registry, when registration with the fisheries or maritime administration is mandatory.
Other data sources may also be considered and are currently being explored, such as household surveys for small-scale fisheries.
For stratum and fishing unit , is calculated as the sum of the number of boats belonging to fishing unit across all sites included in the stratum:
Where:
- is the number of potentially active vessels of fishing unit at site within stratum .
- is the site index, ranging from to . (to complete if required)
- is the total number of sites within stratum .
- is the raising factor for stratum and fishing unit .
4.3 Number of active days: Estimation of the time raising factor ()
The time raising factor represents the total number of days during the reference period that are considered normal fishing days. It is obtained by starting from the total number of calendar days and subtracting days during which fishing is not expected to occur (e.g. weekends, public holidays, or bad weather).
The value of is estimated for a given estimation context (reference period, geographical stratum, and fishing unit). The target population therefore corresponds to all calendar days within the reference period.
For stratum and fishing unit , can be calculated as:
Table 2. Example template for the active days survey.
| Minor strata | Fishing unit (FU) | Number of non-potentially fishing days | Remarks |
|---|---|---|---|
| Strata 1 | FU 1 | 8 | No fishing during Saturday and Sunday |
| FU 2 | 9 | No fishing on Sunday + 5 bad weather days | |
| … | … | … | |
| FU p | 4 | No fishing on Sunday | |
| Strata 2 | … | … | … |
| … | |||
| Strata n |
For example, in Table 2, for Strata 1 and Fishing Unit 2:
When several sites belong to the same stratum, is calculated as the weighted mean of the site-specific values, using the number of boats as weights.
Where:
- is the site index, ranging from to .
- is the total number of sampled sites.
- is the number of active boats at site in stratum for fishing unit .
- is the estimated number of active fishing days at site in stratum for fishing unit .
4.4 Activity coefficient: Estimation of the boat activity coefficient () or fishing activity coefficient ()
4.4.1 Difference between and
The activity coefficient accounts for the variability in fishing activity among boats by estimating the probability that a fishing unit is active on a given day.
Fishing activity can be estimated either through the boat activity coefficient (), based on vertical sampling, or through the fishing activity coefficient (), based on horizontal sampling.
The total fishing effort is therefore estimated as:
or
The effort is expressed in boat-days when CPUE is expressed in kg/day.
Horizontal sampling. Information on fishing activity is collected by interviewing fishers during the landing survey. A typical question asks how many days they have fished during a fixed reference period (e.g. the previous 5 or 30 days). This approach is used to estimate .
Vertical sampling. Fishing activity is estimated by counting, at regular intervals, the total number of boats present at landing sites and the number of boats that actually went fishing. This approach is more demanding but may be preferable where boat movements are important or fishing activity is influenced by seasonal or lunar cycles (e.g. light fishing for sardinellas). This approach is used to estimate .
4.4.2 Boat activity coefficient
For stratum and fishing unit , is calculated by dividing the total number of boats that went fishing by the total number of boats observed (from either the frame survey or the vessel registry):
Where:
- is the site index, ranging from to .
- is the total number of sampled sites.
- is the sampled day index, ranging from to .
- is the total number of sampled days.
- is the number of boats recorded at site in stratum for fishing unit .
- is the number of boats that went fishing on day at site in stratum for fishing unit .
When the frame survey is used, the formula becomes:
(Formula to be completed.)
Where:
- is the number of boats at site in stratum for fishing unit .
4.4.3 Fishing activity coefficient
A simple question can be added to the landing survey questionnaire to estimate fishing activity for each fishing unit:
How many days have you fished over the last 5 days? __________
For one-day fishing trips, a reference period of 5 to 7 days is generally sufficient. For longer fishing trips (e.g. two or three weeks), it is more appropriate to use a 30-day reference period. In this case, the question may be reformulated as:
“How many days have you been on land during the last 30 days?”
The reference period should be defined separately for each fishing unit.
For stratum and fishing unit , is calculated as:
Where:
- is the interview index, ranging from to .
- is the total number of interviews.
- is the number of days the interviewed fisher was active during the reference period.
- is the duration of the reference period (e.g. 5 or 30 days).
- (to check: not used in the current formula).
5. Total catch estimation and catch per species
5.1 Catch per species per stratum
Once the total catch has been estimated, the catch of each species is obtained using the following relationship:
Where:
- is the estimated catch of a given species within the estimation context.
- is the proportion of the total catch represented by the species in the sampled landings.
- is the estimated total catch within the estimation context.
Using the estimated fishing effort, species-specific CPUE values can also be calculated.
5.2 Total catch estimation
The total catch for a given reference period is obtained by summing the estimated catches across all strata (all fishing units and all major and minor strata, when applicable).
Where:
- is the stratum index, corresponding to a unique combination of reference period, geographical stratum, and fishing unit.
- is the total number of strata. (to complete)
6. Estimation quality control
The quality of the estimates is assessed using the different accuracy indicators calculated by the ARTFISH methodology.
Two complementary approaches are used to assess spatial accuracy, which reflects the adequacy of the sampling effort. Temporal accuracy is not estimated because the temporal population (calendar days within the reference period) is considered to be fully defined.
The methodology combines algebraic and probabilistic approaches to evaluate the accuracy of both CPUE and activity coefficient () estimates.
The following indicators are produced:
- Spatial accuracy of the activity coefficient ();
- Temporal accuracy of the activity coefficient (), which is always equal to 1 and therefore does not require estimation;
- Spatial accuracy of CPUE;
- Temporal accuracy of CPUE.
The overall sampling accuracy is defined as the minimum of these four indicators. It should be examined first. If the overall accuracy is low (e.g. below 80%), the individual accuracy indicators can then be used to identify the source of the highest variability.
7 References
Stamatopoulos, C. (2002). Sample based fishery surveys: A technical handbook. FAO Fisheries Technical Paper No. 425. Rome: Food and Agriculture Organization of the United Nations. 132 pp. Available at: https://www.fao.org/3/y2790e/y2790e.pdf